


Weirmark

A data observability web app that watches every pipeline and takes the on-call engineer from alert to fix without leaving it.

FigmaHTMLCSSJavaScript
Open live demoConcept project
ClientConcept — fictional brand
CategorySaaS · Data tools
TypeConcept project
Year2026
Live demoorganoostudio.com/demos/weirmark

The product in motion

The real app running every feature, start to finish.

The brief

When a sync stalls at dawn, the revenue dashboard quietly shows old numbers until someone notices in a meeting.

The idea

Follow one real morning: an incident, a backfill, a plain-language answer and the people who need to know.

What to try

Open the live demo and go from the incident timeline to the lineage impact in five chapters.

Every feature

What each screen does, and why it looks the way it does.

Weirmark — Overview
01

Overview

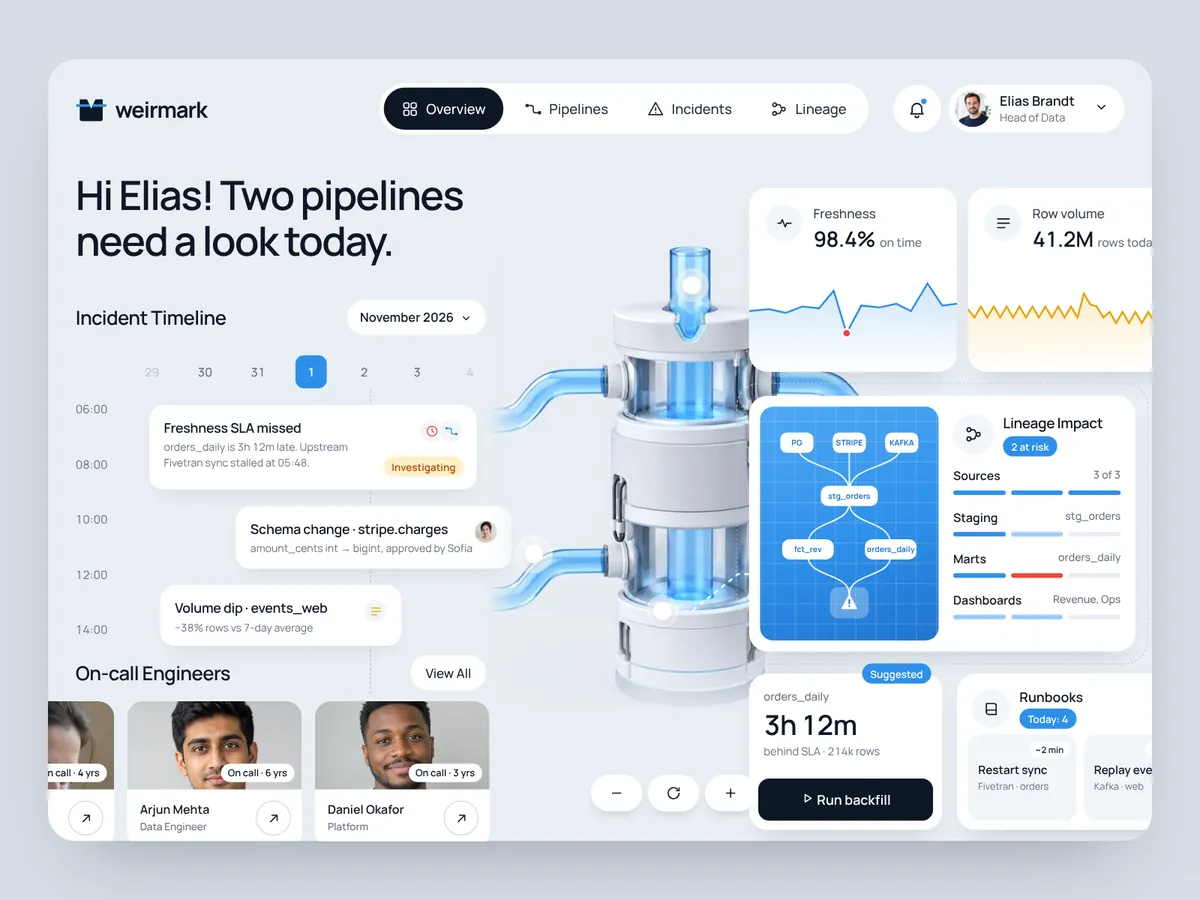
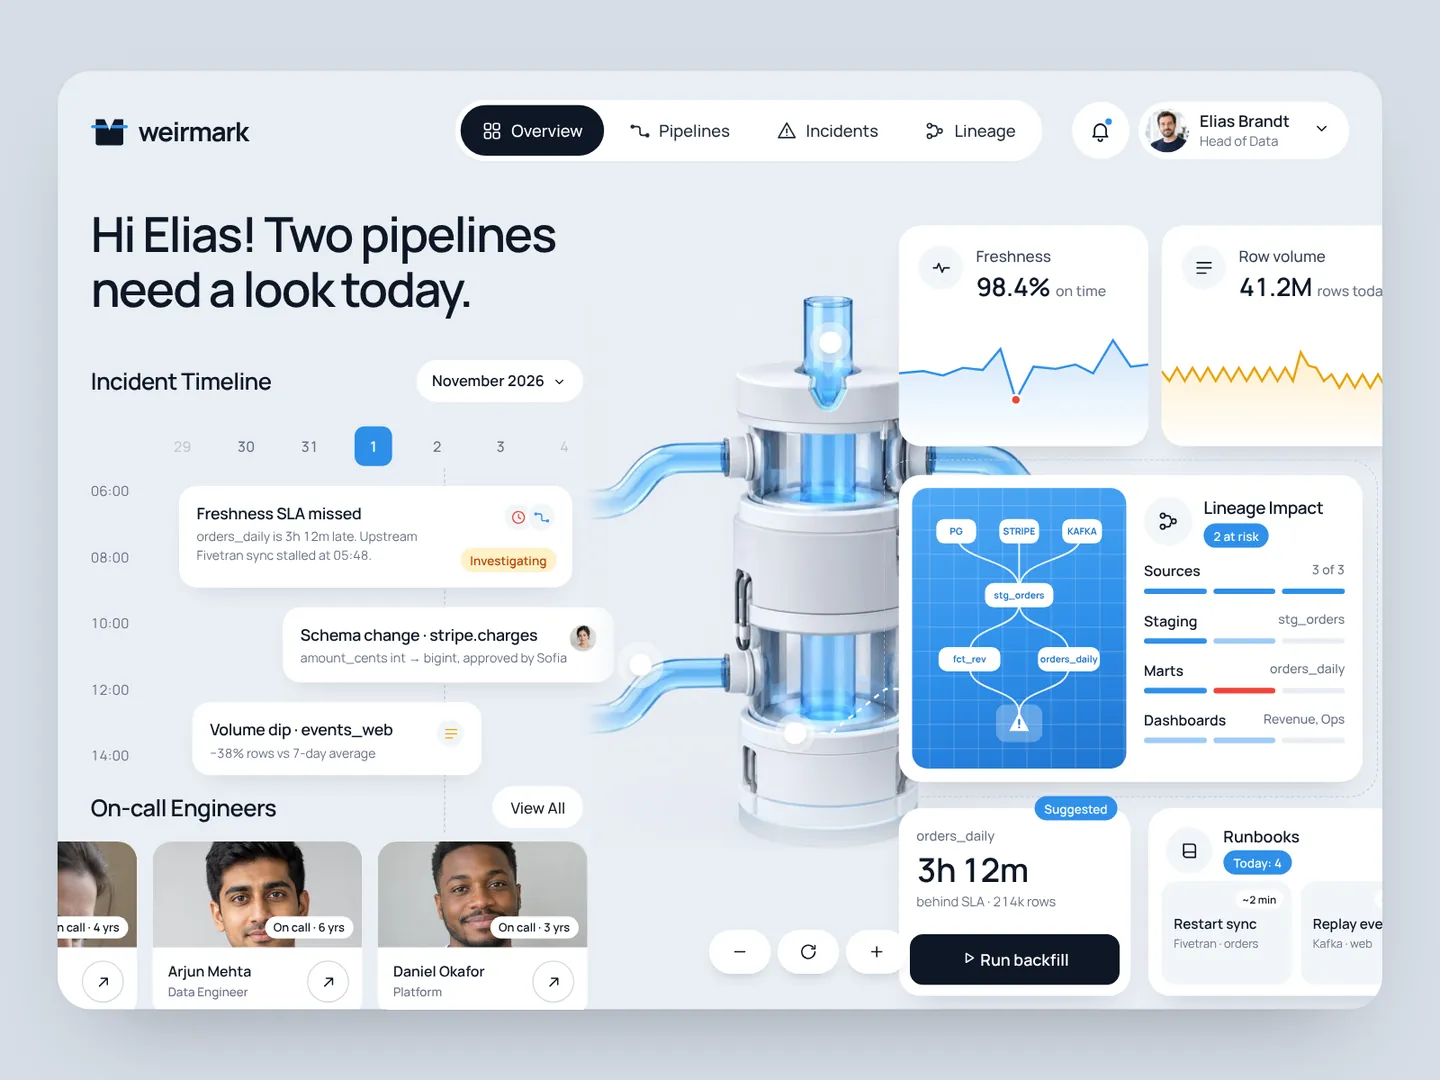
The first screen answers one question: what needs a look today. Incidents sit on a timeline that reads like a calendar, so a missed SLA at 06:00 and a schema change at 10:00 appear in the order they happened. Freshness and row volume live in small metric cards, and the lineage card shows which layer is at risk.
Weirmark — Incident drawer
02

Incident drawer

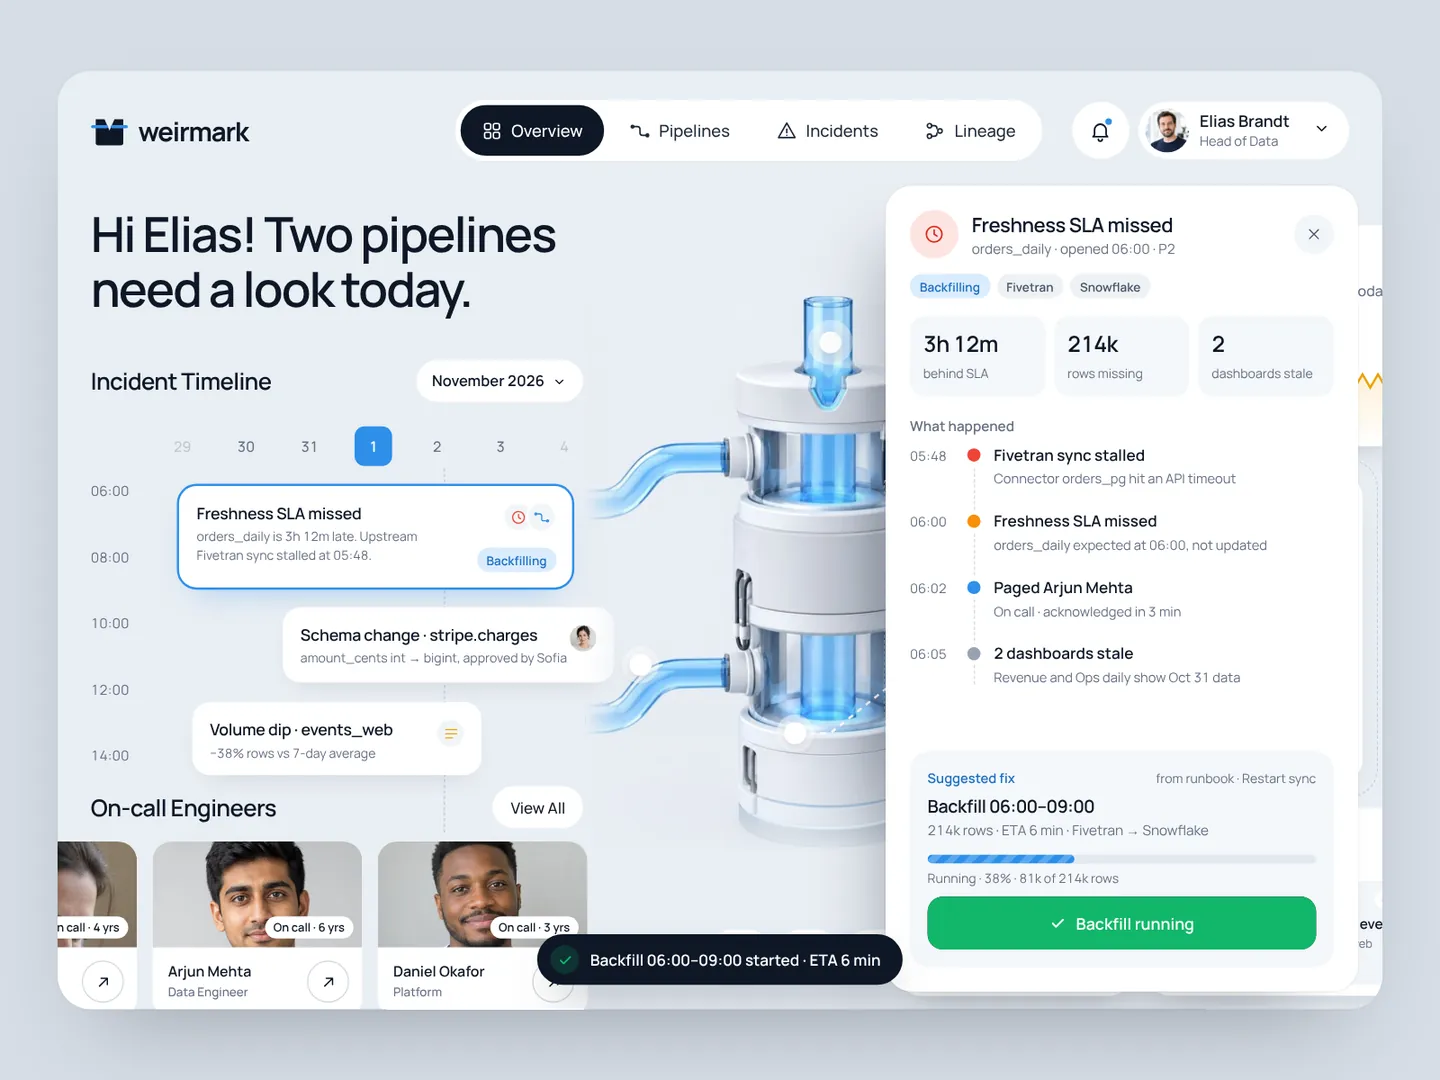
Clicking an incident opens a drawer instead of a new page, so the timeline stays in view. It lists what happened minute by minute, how far behind the data is, and a suggested fix pulled from the team's runbook. One click starts the backfill, and its progress shows inside the same drawer.

Weirmark — Pipelines
03

Pipelines

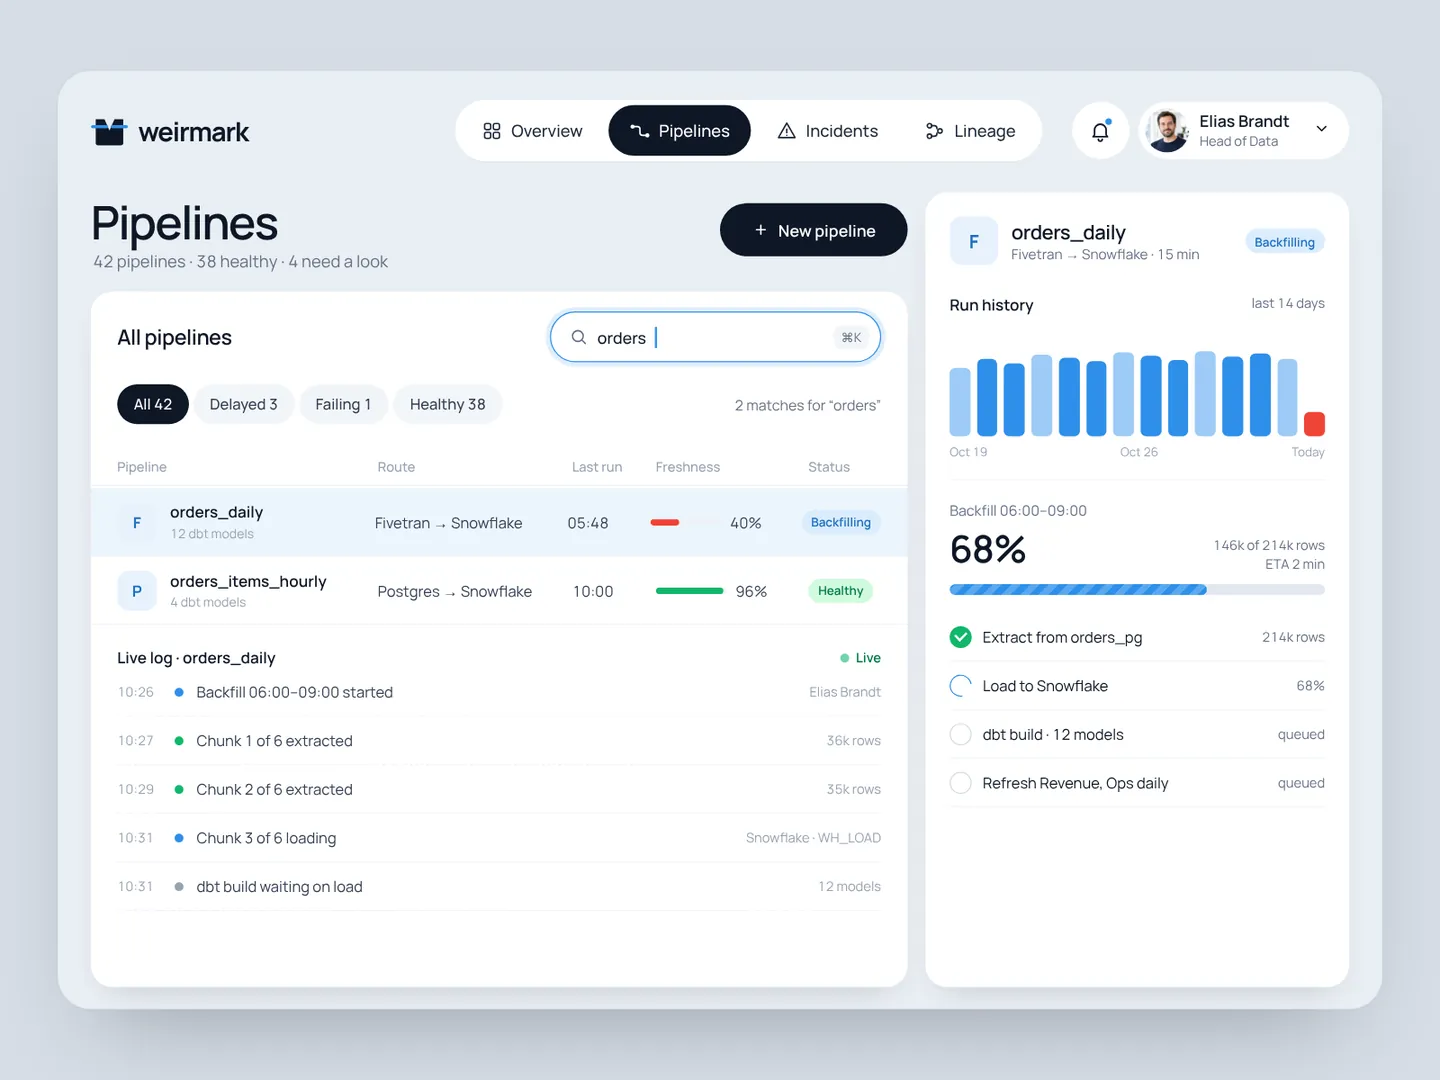
A plain table with route, last run, freshness and status, because engineers scan rows faster than cards. Search filters as you type. Selecting a pipeline opens its run history, live backfill progress and every step from extract to dashboard refresh, with a live log right under the table.

Weirmark — Ask Weirmark
04

Ask Weirmark

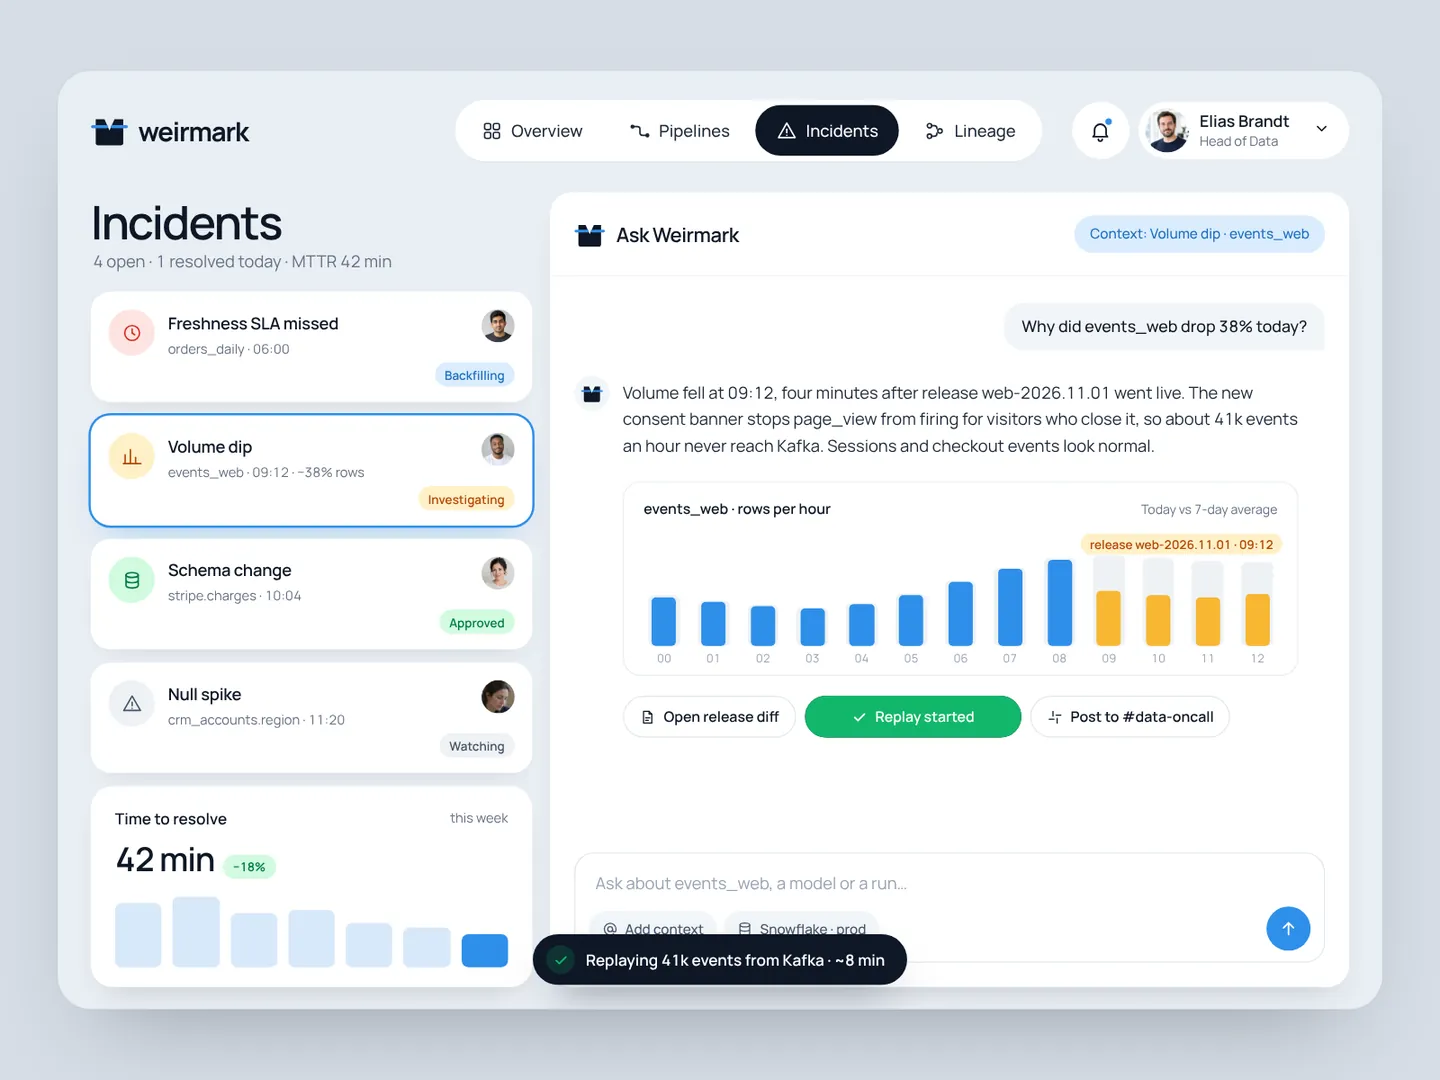
Every incident gets its own assistant thread. You ask in plain language, it reads runs, deploys and lineage, then answers with the cause, a chart that puts today's drop next to the 7-day average, and actions you can run on the spot, like replaying the missing events.

Weirmark — Lineage
05

Lineage

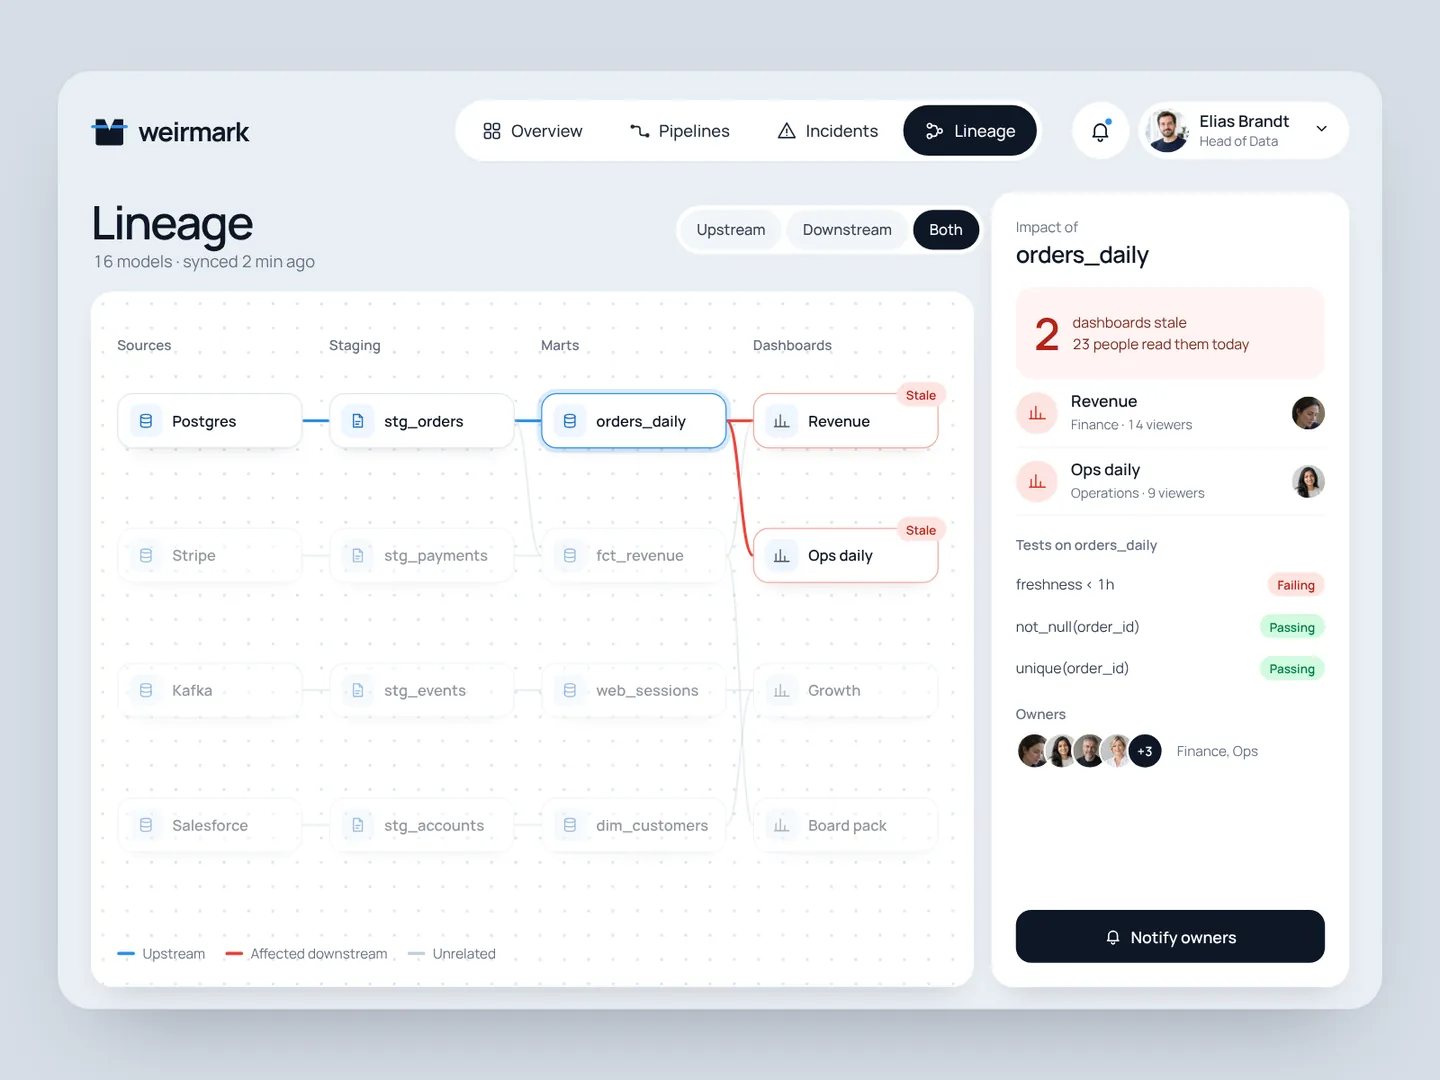
Picking a model highlights what feeds it in blue and what it breaks in red, and fades everything else. The impact panel names the stale dashboards, how many people read them today, the failing tests and the owners, so telling the right people takes one click.

Live demo

Run Weirmark in your browser

Click through the real app yourself, one step at a time, or let it play on its own. Jump straight to any feature.

  • Overview
  • Incident drawer
  • Pipelines
  • Ask Weirmark
  • Lineage
Open live demoHTML, CSS, vanilla JavaScript · runs fully in your browser
Want results like these for your brand?
Book a free 15-min call
← Back to all work